
200MHz MCU Performance Report: Benchmarks & Analysis

200MHz MCU Performance Report: Benchmarks & Analysis

2026-01-22

Lab benchmark suites and field tests show that modern 200MHz MCU implementations routinely deliver substantially higher single-core throughput and lower real-time latency versus 100–150MHz classes. This report establishes a comprehensive framework for evaluation, covering synthetic and real workloads, power and thermal behavior, and practical optimizations for high-speed sensor processing, motor control, and automotive gateways.

The purpose of this performance report is to guide embedded engineers, system architects, and test engineers through repeatable benchmarks, measurement methodology, and actionable tuning steps. The report combines synthetic tests and representative workloads, prescribes environment and compile settings, and supplies templates engineers can use to populate results and iterate toward production-grade performance.

Background — What “200MHz MCU” Means for System Design
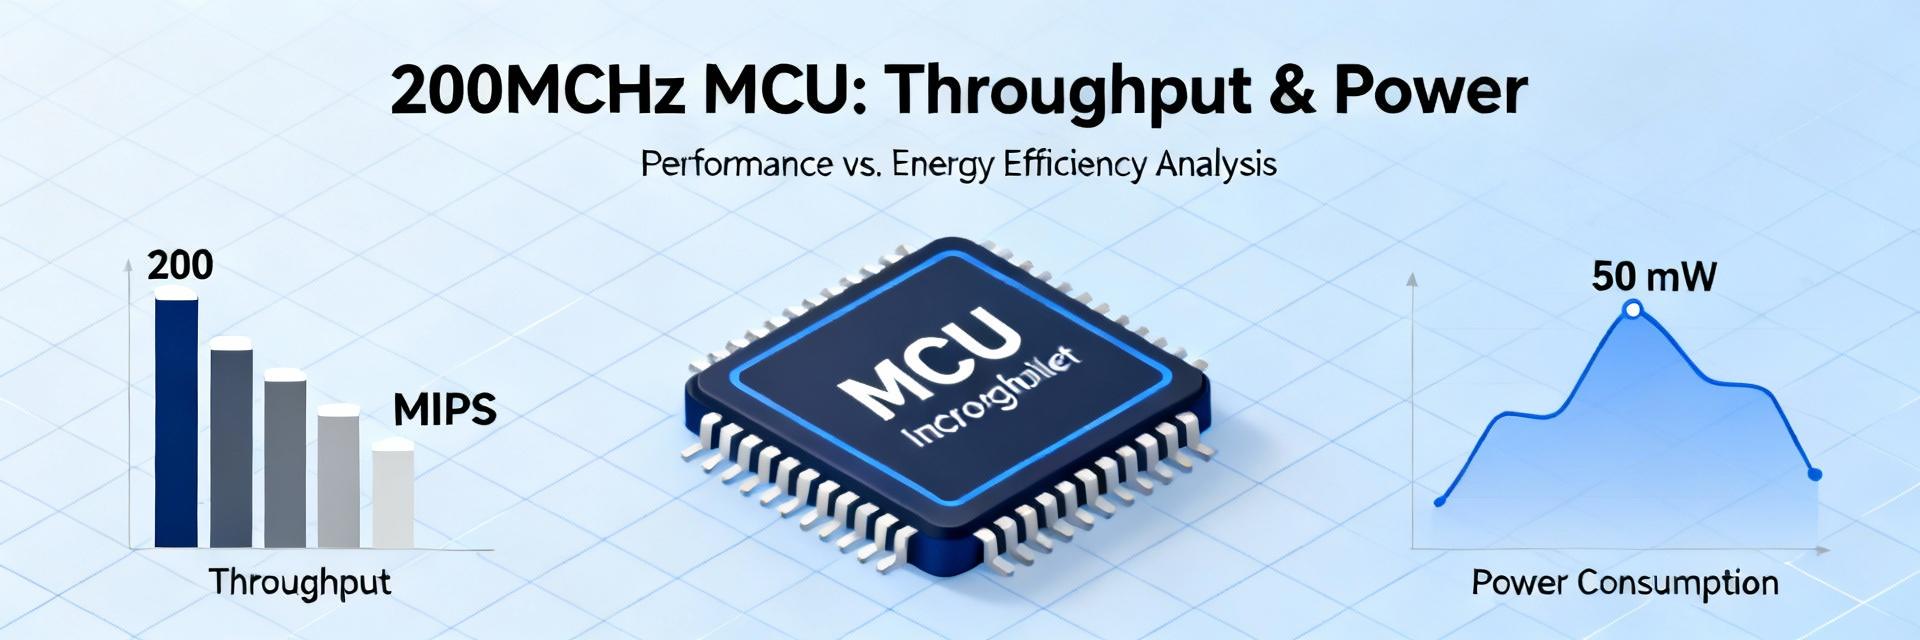
200MHz MCU Architecture and Performance Analysis

Core Architectures & Memory

Typical 200MHz MCU platforms use mid‑performance 32‑bit cores with optional FPU, varying cache and TCM availability, and flash/SRAM tradeoffs. Flash wait states, SRAM access latency, and absence of cache can reduce observed performance; DMA, timers, ADC, CAN/CAN‑FD, and Ethernet peripherals determine offload potential. Measure flash wait states and TCM usage when attributing score differences to architecture rather than clock alone.

Target Applications

Target use cases include real‑time control loops, sensor fusion, edge preprocessing for ML, and high‑speed communications. Expected metrics: sustained throughput (ops/sec), worst‑case latency (µs), and jitter (stddev of latency). Use the following table template to map applications to targets.

Application Key Metric Target Value Visual Target
Motor control Control loop frequency (Hz) ________
Sensor fusion Throughput (samples/sec) ________
CAN gateway Packets/sec, latency (µs) ________

Benchmark Suite & Test Methodology

Synthetic Benchmarks (CoreMark, Dhrystone, EEMBC)

Synthetic benchmarks provide repeatable single‑thread baselines. Run recommended versions with explicit compile flags (example: -O2 or -O3). Capture environment data using the following structure:

  • :: Environment: Board ID, supply regulator, measurement instrument, ambient temp.
  • :: Compiler: Vendor/toolchain, version, flags (e.g., -O3 -flto), FPU/ISA options.
  • :: Measurement: Run count, variance, flash vs RAM execution.

Real-World Workloads

Construct workloads that mirror production: RTOS context switch latency, PID loop frequency, AES throughput, CAN/CAN‑FD packet handling, sensor pipelines, and small NN inference. Recommended outputs include time‑series latency plots, CPU utilization pies, and power vs throughput curves to visualize tradeoffs.

Results — Throughput, Latency & Power Analysis

Single-Core Throughput

Report per‑benchmark tables with absolute scores and score/MHz. A 10–20% uplift in score/MHz often translates to measurable increases in control loop frequency, but plateaus indicate memory or flash wait‑state limits.

Power & Thermal Behavior

Report active current (mA/MHz), energy per operation, and temperature rise. Plot power vs performance to show optimal operating points. Highlight E/op and mW/MHz metrics for efficiency comparison.

Bottleneck Analysis & Optimization Strategies

Common bottlenecks revealed by benchmarks include flash wait states, bus contention, cache misses, and ISR overload. Use the following diagnostic checklist:

Verify Flash Wait States Measure Bus Utilization Profile Cache Misses Inspect ISR Duration
Optimization Strategy Metric to Measure Expected Improvement
Code relocation to TCM Latency, cycles/op Significant (__%)
DMA offload tuning CPU utilization Moderate (__%)

Practical Recommendations & Engineer’s Checklist

MCU Selection Criteria

  • Real-time latency budget & memory type
  • Peripheral mix (CAN-FD, Ethernet, etc.)
  • Security accelerators & power modes
  • Model verification (e.g., GD32F527VMT7)

Deployment Checklist

  • Thermal cycling & EMC checks
  • In-field monitoring hooks (Watchdogs)
  • Telemetry for CPU load & temperature
  • CI-driven regression tests

Summary

  • A disciplined performance report ties synthetic benchmarks and real workloads to measurable design targets.
  • Measure bottlenecks systematically: flash wait states, bus contention, and ISR load often dominate performance outcomes.
  • Validate power and thermal behavior alongside throughput to select the most efficient operating points for candidate parts.

Frequently Asked Questions

How should I benchmark a 200MHz MCU for control loop performance? +
Measure end‑to‑end loop latency and jitter under representative load and interrupt conditions. Run both flash and RAM execution tests, normalize results per MHz, and include DMA activity and ISR timing in the trace. Use CoreMark for baseline CPU throughput and a small fixed‑step PID workload for loop frequency validation.
What benchmarks should appear in a 200MHz MCU performance report? +
Include CoreMark, Dhrystone, and at least one EEMBC suite entry plus real workloads: RTOS context switch latency, PID throughput, AES or crypto throughput, CAN/CAN‑FD packet handling, sensor pipeline, and small NN inference. Report absolute scores, score/MHz, and variance across runs.
How can I confirm firmware optimizations improved my 200MHz MCU performance? +
Use before/after measurement tables capturing the same environment, compiler flags, and measurement scripts. Validate with cycle counts, latency time series, CPU utilization, and power vs throughput plots. Confirm improvements persist across temperature and supply variations to avoid regressions in field conditions.