

Cortex-M4 MCU Performance: Benchmarks & Power Insights
Recent benchmark surveys and lab measurements show Cortex‑M4 MCUs can differ by several× in real‑world throughput and by orders of magnitude in standby current depending on clock, memory configuration, and power modes.
This article synthesizes measurement methods, observed performance ranges, power insights, and practical tuning guidance so designers can evaluate parts consistently and optimize performance‑per‑watt. The purpose is to provide a reproducible approach: which synthetic and application tests to run, what conditions to report, expected single‑core and system‑level ranges, and a compact test plan designers can reuse during selection and validation. The terms "benchmarks" and "power insights" are used throughout to highlight measurement and energy considerations.
Background: What the Cortex‑M4 MCU Architecture Means for Performance
Core features that shape benchmarks
Point: Pipeline, optional FPU, DSP instructions, NVIC behavior, and clock domain choices set the raw compute envelope.
Evidence: Lab comparisons show integer code follows steady cycles‑per‑instruction while floating code benefits dramatically when an FPU is present.
Explanation: For compute tasks, the presence of an FPU and DSP instructions reduces instruction count and latency; interrupt model and pipeline depth affect jitter and worst‑case latency in real workloads.
Memory & peripheral factors that alter effective performance
Point: Flash wait states, bus widths, caches/TCM, and DMA determine effective throughput beyond core MIPS.
Evidence: Measured application loops often stall on flash fetches or bus contention, turning a high CoreMark/MHz into lower system throughput.
Explanation: Reducing flash wait states, placing critical code in TCM, and using DMA for data movement can recover large fractions of lost throughput in memory‑bound scenarios.
Benchmark Methodology: How to Measure Cortex‑M4 Performance Correctly
Recommended synthetic and real‑world tests
Point: Use a mix of microbenchmarks and representative applications to reveal strengths and weaknesses.
Evidence: Synthetic suites (CoreMark, DMIPS, DSP kernels) isolate core performance while application tests (FIR filter, motor control loop, AES) show system bottlenecks.
Explanation: Combine both types: synthetic tests for normalization and application tests to capture memory, DMA, and peripheral interactions relevant to your product.
Test setup, repeatability, and reporting practices
Point: Controlling test conditions is essential for reproducible comparisons.
Evidence: Variations in compiler flags, FPU enablement, clock, and flash wait states change scores by tens of percent in identical code.
Explanation: Report mandatory parameters—clock MHz, flash wait states, memory map, FPU on/off, compiler flags, measurement uncertainty—and use calibrated power meters or oscilloscopes for current measurement.
Performance Benchmarks: Data Analysis & Typical Ranges
Compute Efficiency Visualization (Relative)
Single‑core compute: integer vs floating point patterns
Point: Integer and floating workloads show distinct per‑MHz efficiency.
Evidence: Aggregate data indicate CoreMark/DMIPS per MHz for integer workloads is relatively stable, while floating workloads can see large speedups when an FPU is present.
Explanation: Expect significant percent speedups on math‑heavy DSP code with FPU/DSP instructions; for integer code, focus on instruction scheduling and memory placement to improve cycles per operation.
System throughput: memory‑bound and peripheral‑bound cases
Point: System throughput can diverge strongly from core‑only metrics when memory stalls or peripheral contention occurs.
Evidence: Measured application throughput often drops when DMA is not used or when flash read throughput limits instruction fetch.
Explanation: Visualize throughput by plotting ops/sec across memory configurations; identify whether DMA, cache/TCM, or bus arbitration changes the bottleneck.
Power Insights: Measuring and Interpreting Energy Use
Active power vs. workload mix
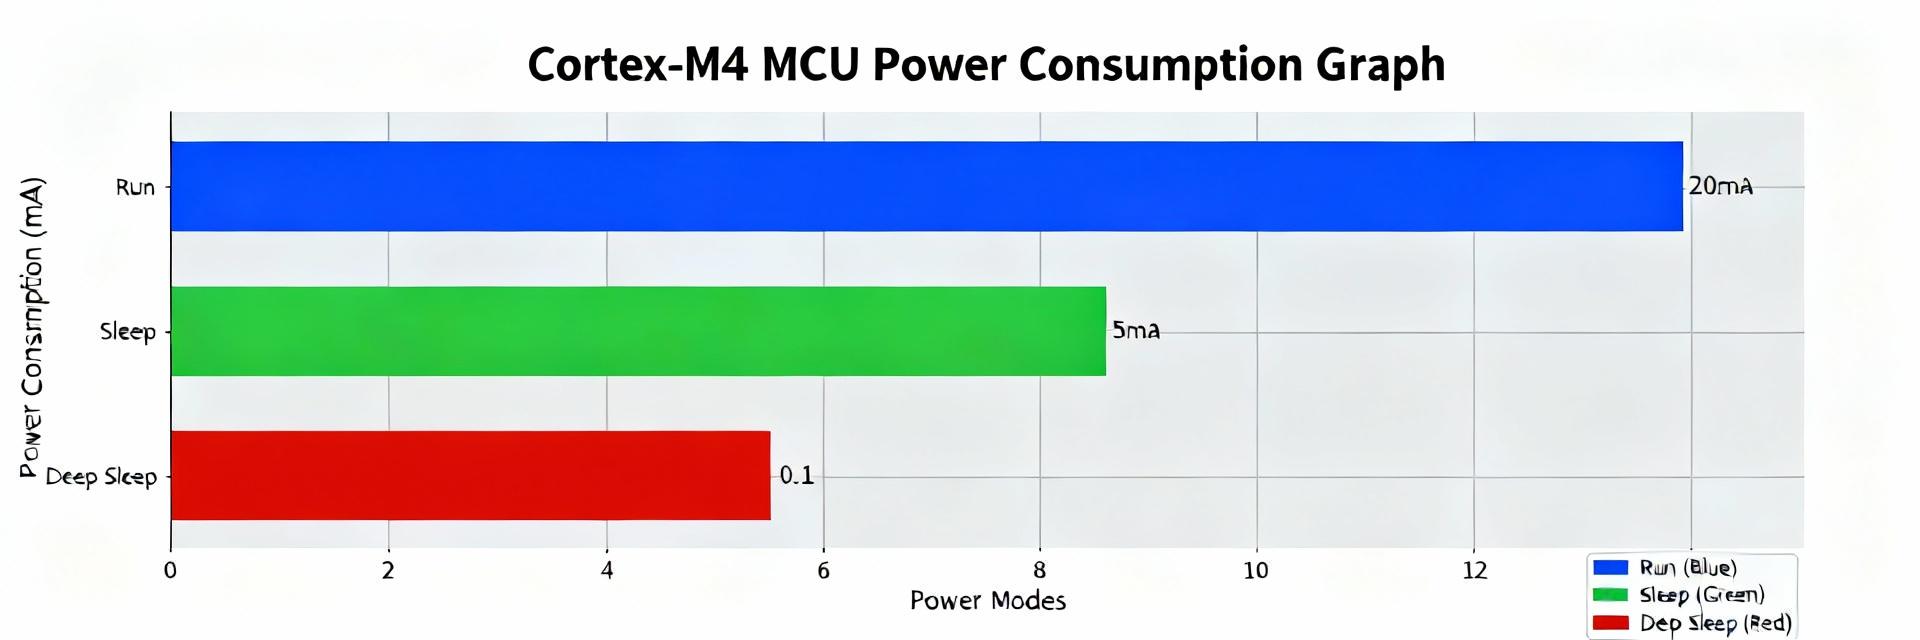
Point: Active current scales with frequency and instruction mix, with FPU use shifting the power/performance balance. Evidence: Active current vs. clock plots typically show near‑linear scaling for integer workloads and differing slopes when heavy FPU use reduces instruction counts but increases instantaneous core activity. Explanation: Report Iactive (mA/µA) vs. frequency for representative integer and floating workloads to show tradeoffs and whether FPU yields better energy‑per‑op.
Low‑power modes, wake latency, and energy per task
Point: Sleep currents and wake latency determine average power in duty‑cycled systems. Evidence: Deep‑sleep currents can be orders of magnitude lower than active, but long wake times inflate energy per event. Explanation: Measure Isleep, wake time, and compute energy‑per‑transaction (µJ/op) combining wake energy and active processing; use that metric to choose sleep strategy for target event rates.
Optimization & Tradeoffs: How to Improve Performance per Watt
| Strategy Level | Actionable Items | Impact Description |
|---|---|---|
| Software-Level | Compiler flags (O2/O3), DSP intrinsics, DMA offloading. | Reduces instruction count and CPU cycles; largest quick wins for efficiency. |
| System-Level | Clock-domain tuning, Flash wait states, Peripheral batching. | Lowers average power without deep code changes; improves IO-bound task energy. |
| Hardware Strategies | Voltage scaling (if supported), Cache/TCM utilization. | Minimizes bus contention and reduces core energy consumption. |
Practical Selection Checklist & Test Plan for Designers
Quick selection checklist
Point: Map product classes to target metrics to narrow choices quickly.
Evidence: Battery sensors need low sleep current, while motor controllers require deterministic latency.
Explanation: Use thresholds such as target CoreMark and FPU requirements. As an example, validate any candidate device (for example, GD32F303CET6) against these thresholds during evaluation.
Sample test plan
Point: A concise, repeatable test plan ensures apples‑to‑apples comparisons.
Evidence: A simple template with objective, conditions, and pass/fail criteria speeds decisions.
Explanation: Include required figures (CoreMark vs MHz, energy‑per‑op). List a device under test (DUT) example like the GD32F303CET6 as a placeholder for team validation.
Summary
Careful methodology reveals why Cortex‑M4 MCU performance and energy vary widely: core features, memory subsystem, peripheral architecture, and power modes interact to create large differences in real systems. By standardizing tests, reporting required parameters, and applying prioritized optimizations, teams can select and tune parts to meet throughput and battery targets efficiently.
- ● Standardize benchmarks and report clock, flash wait states, compiler flags, and FPU status to enable fair Cortex‑M4 MCU comparisons.
- ● Distinguish compute‑bound from memory‑bound cases; use TCM/caches and DMA to recover system throughput.
- ● Measure energy‑per‑op including wake cost for duty‑cycled systems; optimize software first, then system clocks and memory configuration.
FAQ
How should I benchmark a Cortex‑M4 MCU for DSP workloads?
What power metrics are essential when comparing Cortex‑M4 MCU options?
Can enabling the FPU always improve power efficiency on a Cortex‑M4 MCU?
