

GD32F130C8T6 Benchmarks & Power Efficiency Report Guide
A professional compilation of standardized benchmarks and power-profile measurements for the 48MHz Cortex-M3 microcontroller. This guide assists embedded engineers in quantifying performance and optimizing energy consumption for battery-constrained applications.
Background: The Role of GD32F130C8T6 in Low-Power Embedded Designs
Hardware Summary & Typical Use Cases
The target device is an entry-level Cortex-M3 class MCU optimized for cost and board space. Typical attributes include a single-core Cortex-M3, up to 48 MHz CPU, 16–64 KB Flash options, 6–20 KB SRAM, and common peripherals such as GPIO, UART, SPI, I²C, ADC, and timers. These specifications make it suitable for battery sensors, simple motor drivers, and IoT endpoints where footprint and BOM cost are primary constraints.
Why Benchmarking & Power Profiling Matter
For entry-level MCUs, small changes in clock or peripheral usage yield large battery impacts. Developers measure throughput (CoreMark-style or cycles/op) and energy (µJ/op, mA in various states) to quantify trade-offs. Benchmarks inform critical decisions on clock selection, DMA vs. CPU workload, and voltage regulator choices to optimize power efficiency for target SLAs such as battery life or latency.
Benchmarking Scope & Target Metrics
Workloads & Metrics
A compact benchmark suite covers synthetic CPU tests and representative I/O tasks:
- •CoreMark / Dhrystone Equivalents
- •Sensor Sampling + Digital Filtering
- •CRC & SPI/UART DMA Transfers
- •RTOS Context-Switch Latency
Reproducibility Checklist
Reproducible results require fixed test conditions:
- •Fixed Supply Voltage (e.g., 3.3V)
- •Clock Sources (48/24/8 MHz)
- •Compiler Flags (-O2 / -Os)
- •N=10 Runs for Statistical Confidence
Measurement Methodology & Tools
Power Measurement Hardware: Accurate, low-noise current measurements are essential. Use a low-value shunt with a differential ADC or a precision power analyzer. Inline current-sense amplifiers work well for the µA-to-mA range. Place the shunt close to the MCU supply pin, use four-wire sensing, and capture high-speed transients to quantify wake and sleep energy accurately.
Firmware Practices: Deterministic firmware reduces variance. Disable extraneous interrupts, isolate tight test loops, and toggle a GPIO for timing markers. Use compiler optimization consistently and instrument wake pathways to measure latency.
Benchmark Results: Performance vs. Power
Performance Efficiency Visualization
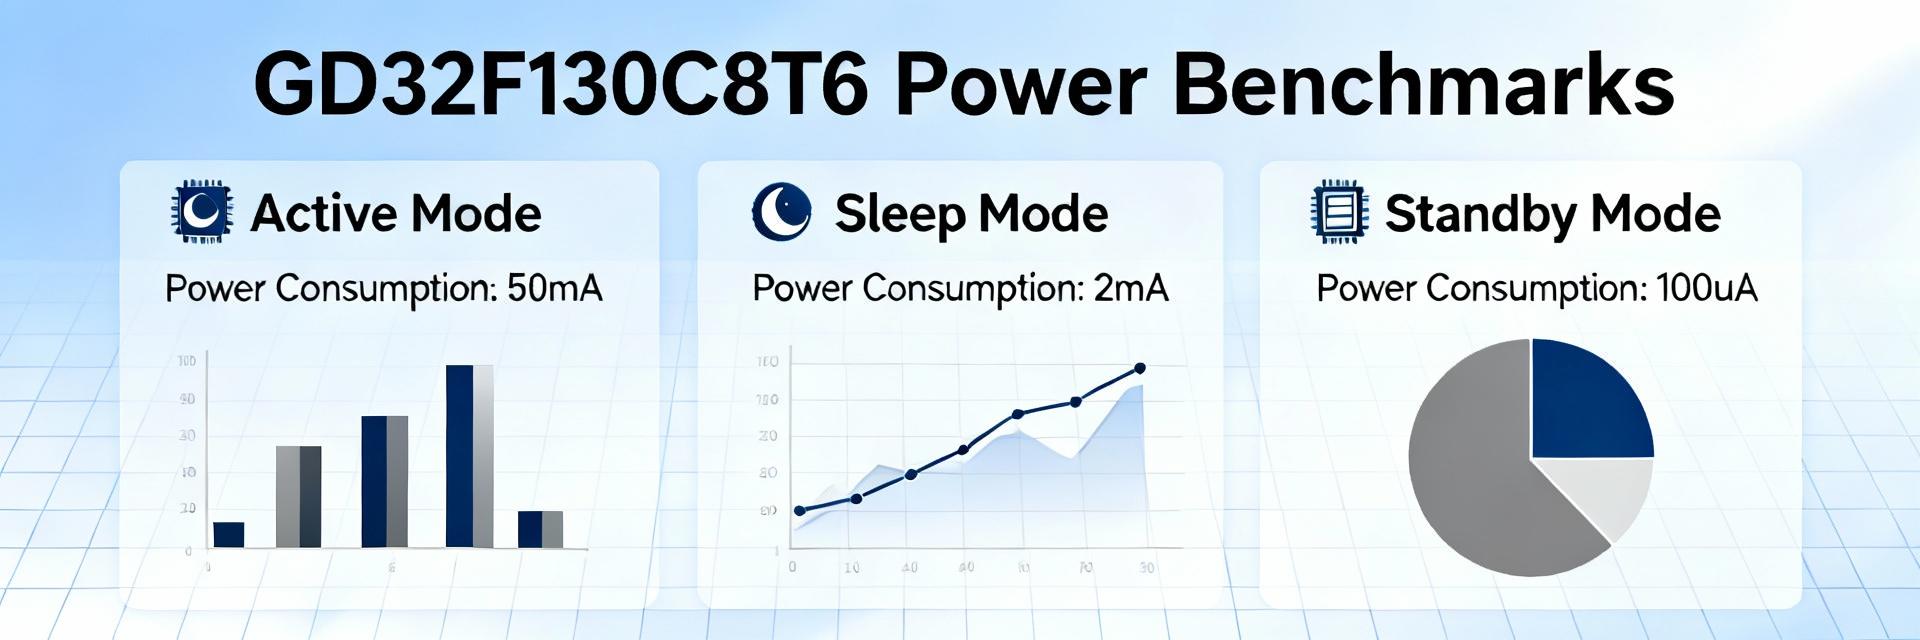
Presenting results as frequency-swept tables clarifies trade-offs. Look for frequency "sweet spots" where performance per mW is maximized. Sleep behavior and wake energy dominate battery life for intermittent workloads. Report deep-sleep current in µA and standby current in µA, alongside wake latency (µs–ms) to show practical lifetime implications.
Case Studies: Applying Benchmarks
Battery-Powered Sensor Node
Example: Sampling every 30s, 10ms active processing, radio transmit 50ms. Use measured active current and wake energy to estimate battery life. Recommend lowering CPU clock or batching samples to reduce average power; offloading CRC to DMA cuts CPU active time.
Low-Latency Control Loop
Control loops prioritize throughput. Raising CPU clock reduces cycle latency but increases mA. Batching control computations to reduce wake events can save energy. Tune prescalers and pick the configuration that meets jitter requirements while minimizing net energy.
Optimization Checklist & Recommendations
Firmware Optimizations
Prioritize lowest acceptable clock, aggressive sleep between events, and DMA for data transfers. Use -Os or -O2 compiler flags, inline critical paths, and avoid polling to reduce peripheral enable time.
Hardware & System-Level
Use low-dropout (LDO) regulators with low quiescent current. Configure GPIOs to low-leakage states during sleep and eliminate unnecessary pull-ups. Maintain a change log of measured currents to attribute improvements reliably.
Summary
Common Questions & Answers
