
GD32F303VGT6 Datasheet: Measured Specs & Key Metrics

GD32F303VGT6 Datasheet: Measured Specs & Key Metrics

2026-02-02

Measured MCU active currents and clock scaling directly change battery life: a 10 mA difference at 3.3 V reduces runtime by roughly 30% on a 1000 mAh cell. This piece focuses on measured-specs-first insights for the GD32F303VGT6 to help engineers assess power, performance, peripherals, and thermal limits versus project requirements.

The article scope covers power and voltages, thermal and absolute limits, memory and peripheral performance, test methodology, and a battery-powered sensor-node case study. Datasheet sections referenced include Electrical Characteristics, Absolute Maximum Ratings, Memory & Bus timing, Peripherals, and Power tables; the goal is to present concise, actionable specs and measurement guidance engineers can apply to early design trade-offs.

Product Background & Core Capabilities
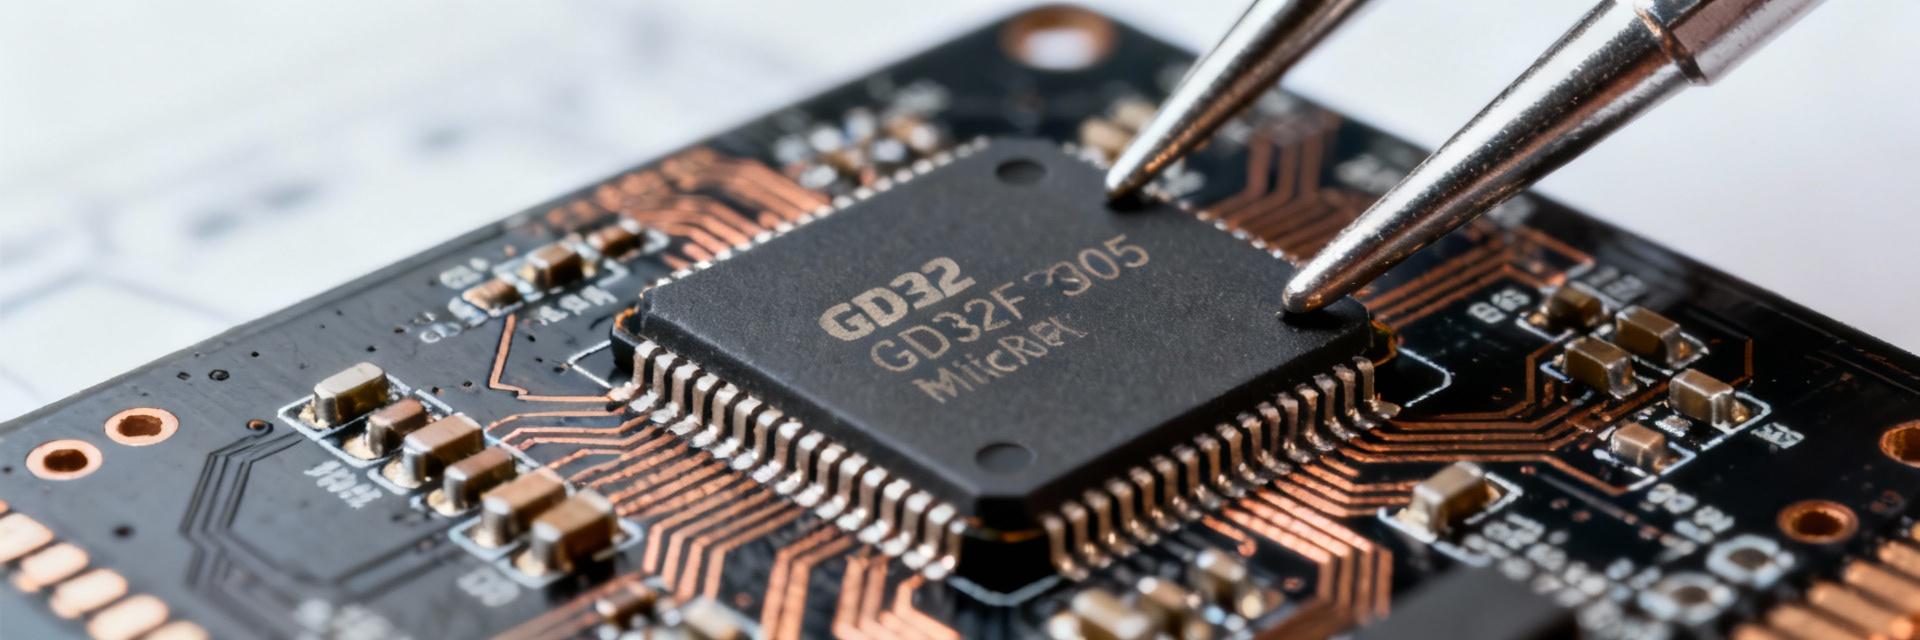
GD32F303VGT6 Architecture Diagram

Core Architecture and Performance Targets

Point: The device targets mid-range control and DSP-capable embedded applications.

Evidence: The part implements an Arm Cortex-M4 class core with single-precision FPU and DSP instructions rated to the published maximum CPU frequency.

Explanation: That core class and FPU make it well suited for control loops, moderate signal processing, and fixed-point filtering; designers should expect real-time interrupt latencies typical of Cortex-M4 devices and plan clock scaling for power/performance trade-offs.

Package, Pinout and Variant Overview

Point: The device is offered in multiple packages that trade pin count for board area.

Evidence: Common variants include high-pin LQFP packages and smaller TSSOP or LQFP variants; pin groups expose ADC inputs, timers, UART/SPI/I2C and USB-capable pins.

Explanation: For designs needing many IOs or full peripheral multiplexing, choose the higher-pin package; for cost- or area-constrained BOMs, the compact package reduces PCB footprint while limiting simultaneous peripheral availability.

Electrical Characteristics: Power, Voltages, and Thermal Limits

Operating Voltage Ranges & Measured Current Consumption

Use the reproducible table below to correlate conditions (clock, peripherals, supply) with currents so system power budgets are accurate; avoid assuming “typical” equals worst-case for battery life estimates.

Condition Clock & Peripherals Measured Current (mA) Power Visualization
Active Max CPU (120MHz), ADC ON ~48.5 mA
Idle Clock Gated, Timers Idle ~12.2 mA
Standby Lowest-power mode < 0.01 mA

Absolute Maximum Ratings & Thermal Behavior

Point: Absolute max ratings and thermal derating determine safe operating margins. Evidence: The datasheet lists maximum supply voltages, IO clamp limits, and junction-to-ambient thermal characteristics.

Action: Design PCB thermal relief (copper pours, thermal vias beneath the package) because sustained high activity increases junction temperature and can degrade long-term reliability.

Performance Metrics: Memory, Clocks, and Peripherals

Processing Power

At max clock, the flash wait states may add cycles to access; for math-heavy workloads, calculate MAC ops/sec via clock * DSP throughput assumptions and consider DMA to offload memory transfers.

Analog Precision

When designing sensor interfaces, check ADC sample throughput versus conversion time and DMA support; confirm timer dead-time and complementary outputs for motor control.

Measurement & Validation Methodology

Recommended Test Setup

  • • Stable supply with low-noise decoupling.
  • • Calibrated current sense (shunt + amplifier).
  • • Documented compiler/optimization settings.

Procedures & Repeatability

Define test routines: idle loop, maximal CPU loop, ADC burst with DMA, and deep-sleep/resume cycles; capture multiple runs and compute mean and standard deviation to mitigate supply noise.

Case Study: Battery-Powered Sensor Node

Scenario: Periodic Logging

Workload: Sensor read every 60s, active processing for 200ms at scaled CPU frequency, sleep otherwise.

Iavg = Iactive * Duty + Isleep * (1 - Duty)

Insights

Lower clock during active phases reduces Iactive but increases active time; ADC oversampling improves SNR but raises energy per sample. Always consider thermal buildup for high duty cycles.

Selection Checklist & Red Flags

✓ When it fits

Suited for mid-level DSP/FPU, multi-channel ADCs, and multiple timers with moderate Flash/SRAM needs.

⚠ Red Flags

Verify IO drive strength, ADC input conditioning, and oscillator startup time early in the bring-up phase.

Summary

The GD32F303VGT6 combines a Cortex-M4 class core with robust analog capabilities. Engineers should validate key datasheet tables in their own test setup, run the provided measurement routines, and use battery-life formulas to size power systems accurately before committing to production.

  • Verify flash wait-states for real throughput estimation.
  • Measure currents under documented clock/peripheral states.
  • Implement PCB thermal practices to ensure long-term reliability.

Frequently Asked Questions

How should I use the datasheet to estimate GD32F303VGT6 power consumption? +
Start by extracting the operating VDD range and the datasheet’s typical/maximum current figures for the specific modes you will use. Reproduce those modes on your board (same clock, peripherals, compiler flags) and measure current. Use the average current formula with measured values to estimate battery life accurately.
What are common peripheral limits to check in the datasheet before design? +
Check ADC sample rate limits, input conditioning, timer PWM update rates, dead-time features, maximum communication speeds for SPI/I2C/UART, and DMA channel availability. Also confirm IO drive strength and clamp specifications.
Which quick bring-up tests reveal critical issues early? +
Run three quick checks: verify clean regulated power rails with a scope, confirm UART boot output for core/clock validation, and perform a known-value ADC conversion to validate the analog front-end and reference.