

Low-Power 32-bit MCU Benchmarks: Power vs Performance
Recent lab comparisons reveal orders-of-magnitude variation in energy-per-operation across modern parts. This article presents a repeatable benchmarking framework and concrete metrics to compare low-power MCU trade-offs effectively.
Engineers will find a measurement-first methodology, visualization templates to map candidates onto Pareto frontiers, and a compact validation checklist for product selection. The goal is reproducible benchmarks that drive design choices for battery sensors, wearables, and intermittent compute nodes without relying on datasheet claims alone.
Why Low-Power 32-bit MCUs Matter
Market & Application Segments to Prioritize Power
Product class dictates the dominant metric. Evidence shows battery sensors often need standby currents below 1–5 µA, while wearables prioritize wake-up latency and edge nodes focus on sustained throughput.
Defining the Power vs Performance Trade-off
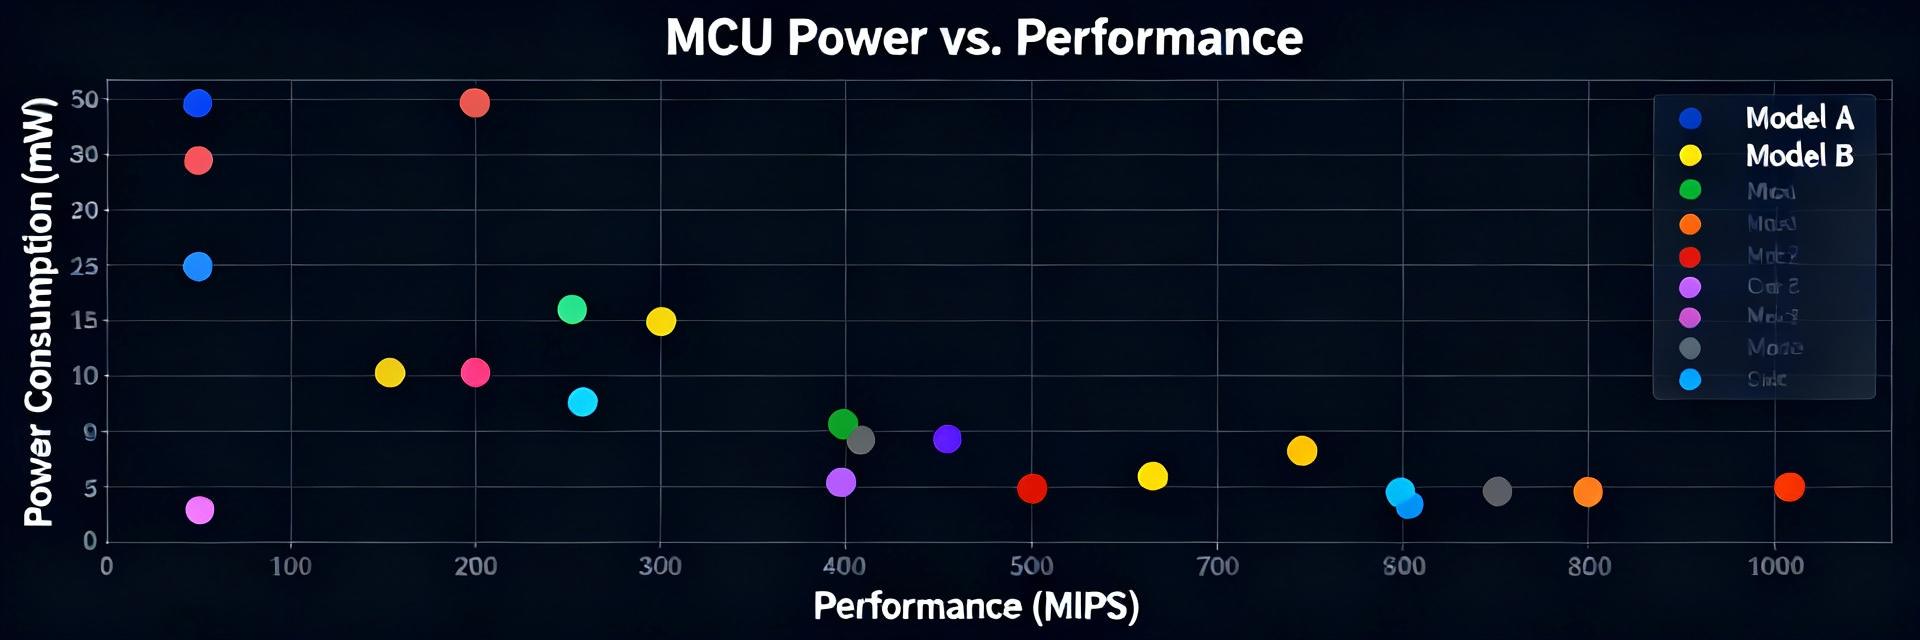
The trade-off is multi-dimensional. Continuous throughput, energy per task, and peak power pull designs in different directions. Think Pareto — no single part wins every axis. Use power-performance plots to reveal candidates that balance energy-per-operation against required sustained or peak performance.
Benchmark Methodology & Test Setup
Measurement Hardware and Repeatability
Precise current measurement is foundational. Use a precision DC source, a low-value shunt or precision meter, and isolate the measurement path on the PCB. Add decoupling, control temperature, and capture high-resolution samples; calibrate offsets and verify repeatability across power cycles for trustworthy benchmarks.
Test Conditions, Power Modes, and Scenarios
A consistent test matrix prevents misleading results. Include supply voltages, multiple clock points, sleep modes, peripheral-only activity, RF idle/active, and wake-up latency. Name scenarios clearly and log conditions; reproducible benchmarks require the same sequence and measurement windows for each part tested.
Key Metrics: Quantifying Performance
Power Metrics
Capture both instantaneous and integrated quantities. Measure idle/standby current (µA), active current at declared MHz (mA), power (mW), energy-per-task (µJ/op), leakage, and wake-up energy.
Performance Ratios
Combine raw throughput with energy to rank parts. Use CoreMark or DMIPS; compute DMIPS/mW, CoreMark/mW, and ops/µJ. Energy-per-op = (active current × voltage × active time) / operations.
Presenting Results & Optimization
Visualization and Pareto Optimality
Visual templates make trade-offs obvious. Provide a multi-column comparison table and a scatterplot with a Pareto overlay. Choose slightly less efficient parts when they provide unique hardware such as crypto engines, DSP, or accelerators. For example, include the GD32L233KBT6 in candidate lists to validate feature/value trade-offs.
Optimization Strategies
- ■ Hardware: Employ clock gating, peripheral power domains, low-leakage regulators, and hardware accelerators.
- ■ Firmware: Use tickless idle, I/O batching, DMA offload, and energy-aware scheduling. Compile with LTO and O3 selectively.
Selection & Validation Checklist
Score candidates against prioritized needs using a decision matrix. For a wearable, prioritize wake-time and peripherals; the GD32L233KBT6 can be evaluated against these criteria during a hardware proof-of-concept.
Final Validation: Run the full benchmark suite on samples mounted on the target PCB, test thermal extremes, and measure supply behavior during RF bursts before committing to volume orders.
Summary
- ✓ Define dominant metrics early (standby µA, energy-per-task, wake-up time) and use reproducible benchmarks to rank candidates against real workloads.
- ✓ Use combined metrics (CoreMark/mW, ops/µJ) and Pareto scatterplots to shortlist parts; trade extra efficiency for unique hardware only when justified.
- ✓ Validate on target PCB, log repeatable test runs, and require benchmark pass/fail evidence before procurement commitment.
Common Questions
How do I benchmark a low-power MCU for energy-per-task? +
What power performance metrics should I prioritize for a wearable low-power MCU? +
Can I trust vendor datasheet numbers when selecting a low-power MCU? +
